How to set up monitoring of CPU and memory usage for C++ multithreaded application with Prometheus, Grafana, and Process Exporter


Have you ever wondered how to know how much CPU and memory resources is your app taking during a week? Or how to collect and visualize this data to get some useful insights? In this guide, I will show you how to do it with Grafana, Prometheus, and possibly minor updates to your C++ app.
💡 This was tested on Ubuntu 20.04 on x86_64 and aarch64 architectures.
Tools Setup
Install Prometheus
Following Prometheus official setup guide: https://prometheus.io/docs/introduction/first_steps/.
wget https://github.com/prometheus/prometheus/releases/download/v2.33.1/prometheus-2.33.1.linux-amd64.tar.gz
tar xvfz prometheus-2.33.1.linux-amd64.tar.gz
cd prometheus-2.33.1.linux-amd64
./prometheus
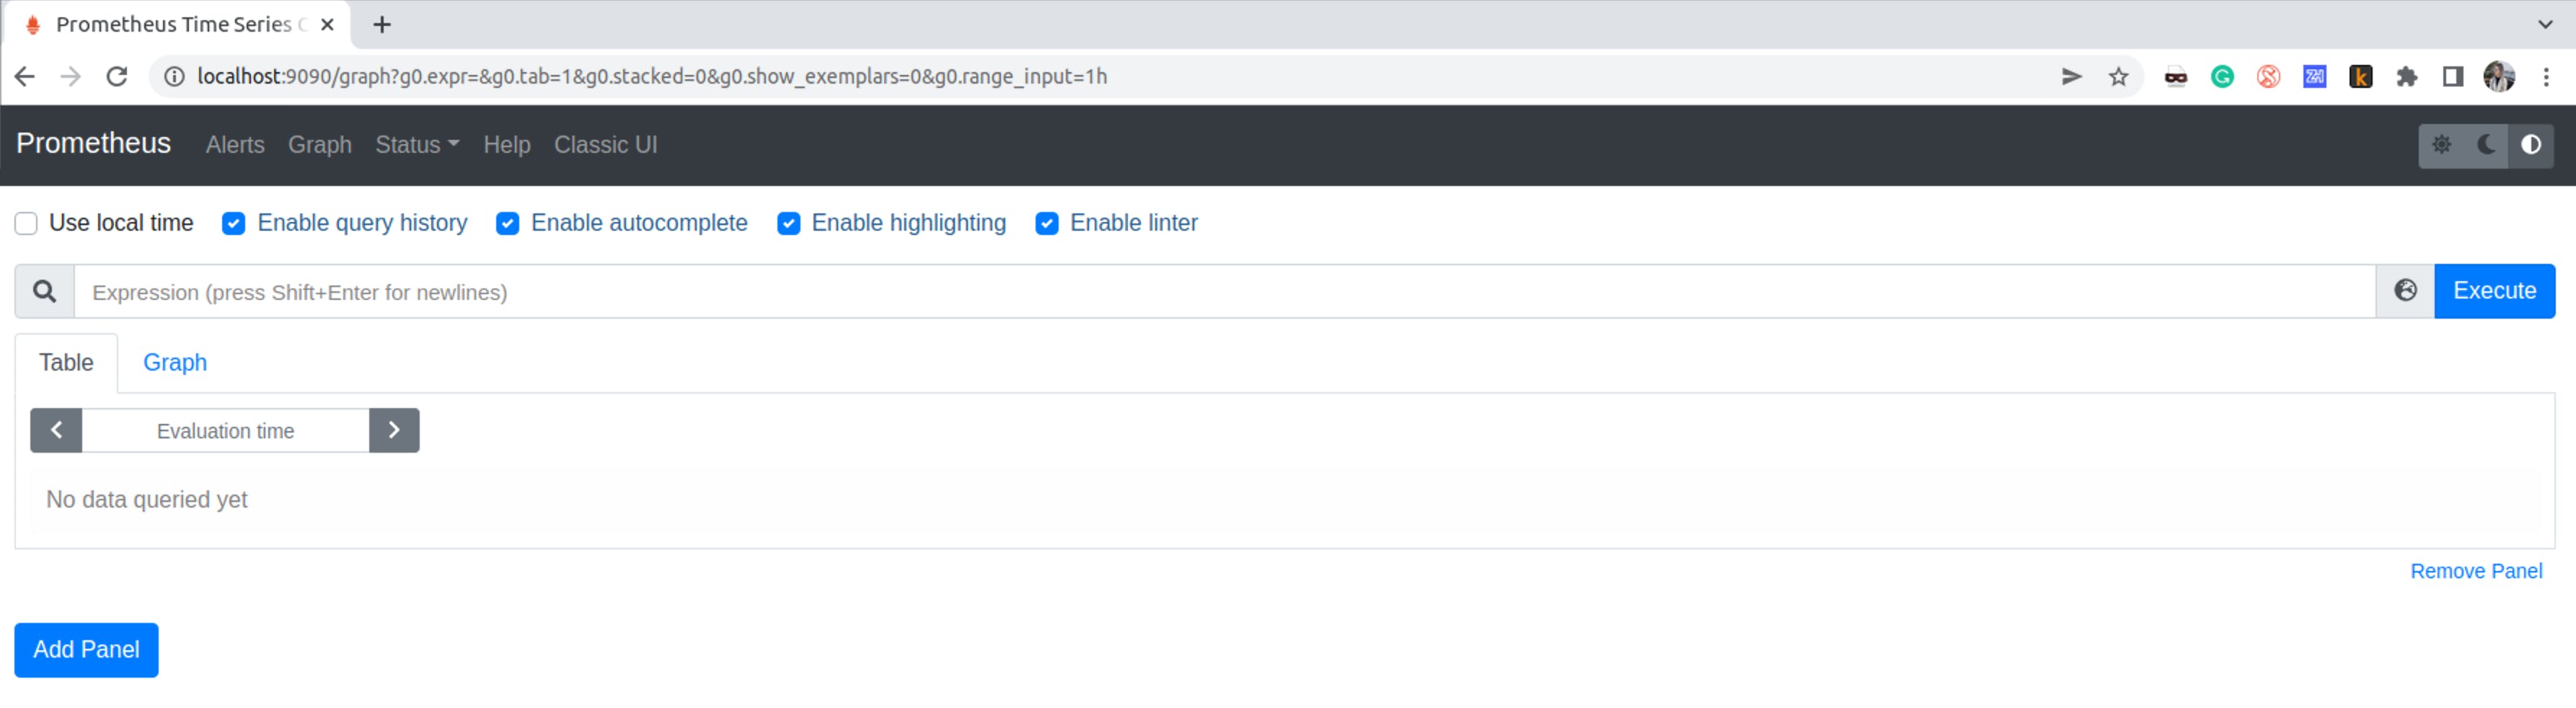
You should be able to load Prometheus UI at http://localhost:9090.
Install Process Exporter
Process-exporter - is a Prometheus exporter that mines /proc to report on selected processes.
wget https://github.com/ncabatoff/process-exporter/releases/download/v0.7.10/process-exporter-0.7.10.linux-amd64.tar.gz
tar xvzf process-exporter-0.7.10.linux-amd64.tar.gz
cd process-exporter-0.7.10
Run process exporter specifying your process name
./process-exporter-0.7.10 -procnames <your_app_name>
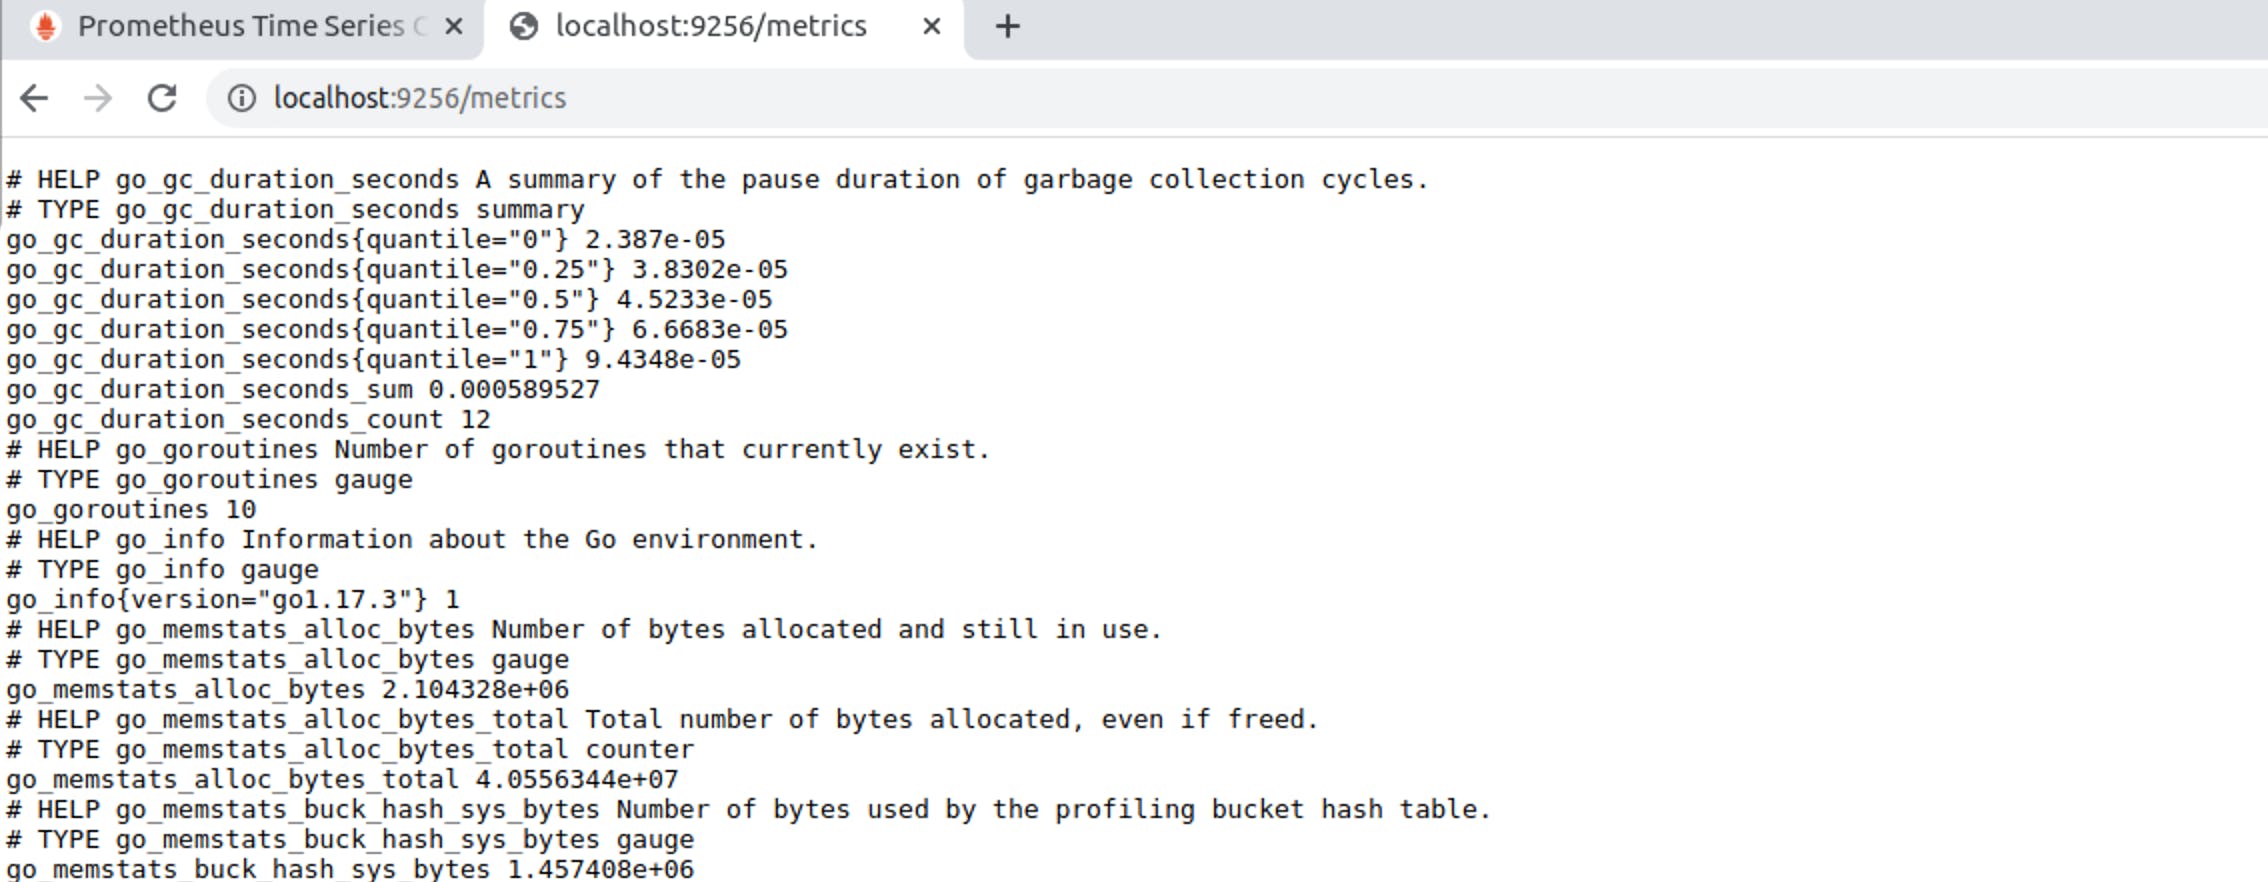
You will see the following printout where you could also have a look at the metrics for your process via http://localhost:9256/metrics.
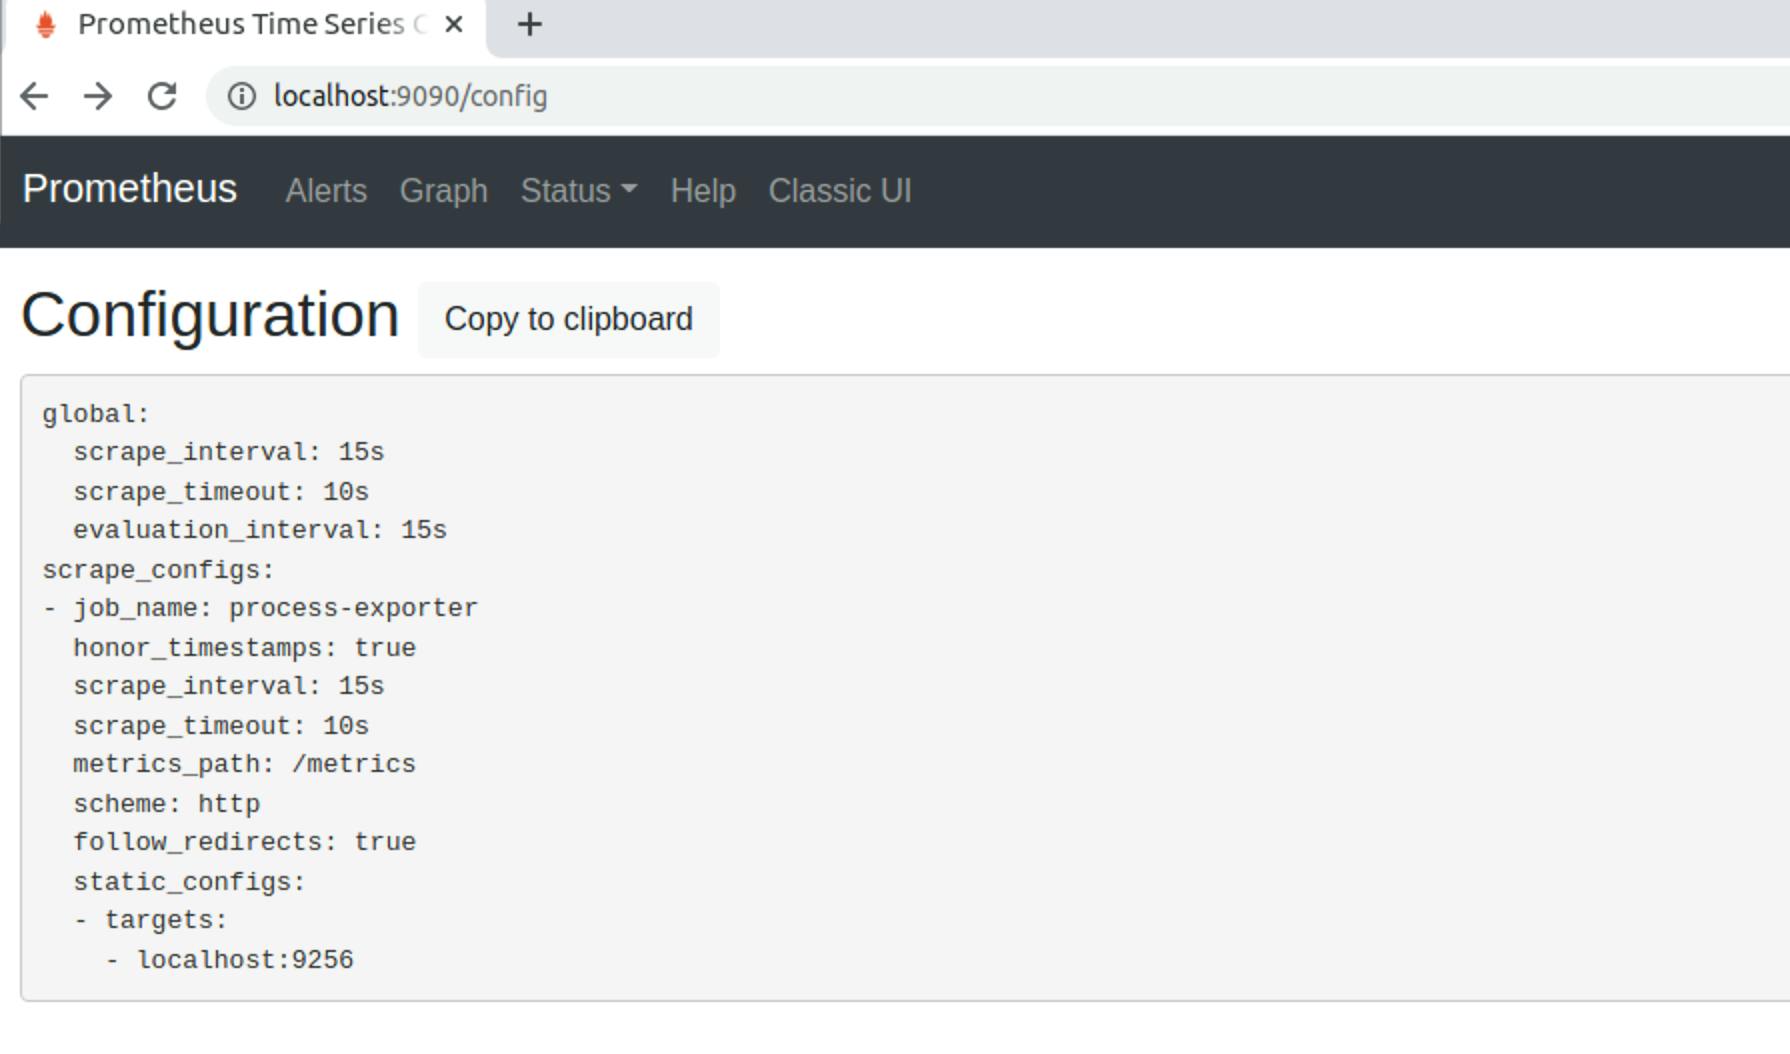
Configure Prometheus to digest metrics from process-exporter
Open prometheus.yml in ./prometheus-... root folder. Add process-exporter to scrape configs:
global:
  scrape_interval: 15s
scrape_configs:
  - job_name: "process-exporter"
    static_configs:
      - targets: ["localhost:9256"]
Restart Prometheus:
./prometehus --config.file="./prometheus.yml"
Install Grafana
Follow Grafana Install Guide for more information. Or you can also use Grafana Cloud solution, please go here for instructions.
sudo apt-get update
sudo apt-get install grafana-enterprise
sudo systemctl start grafana-server
Check out http://localhost:3000. By default credentials are admin:admin credentials.
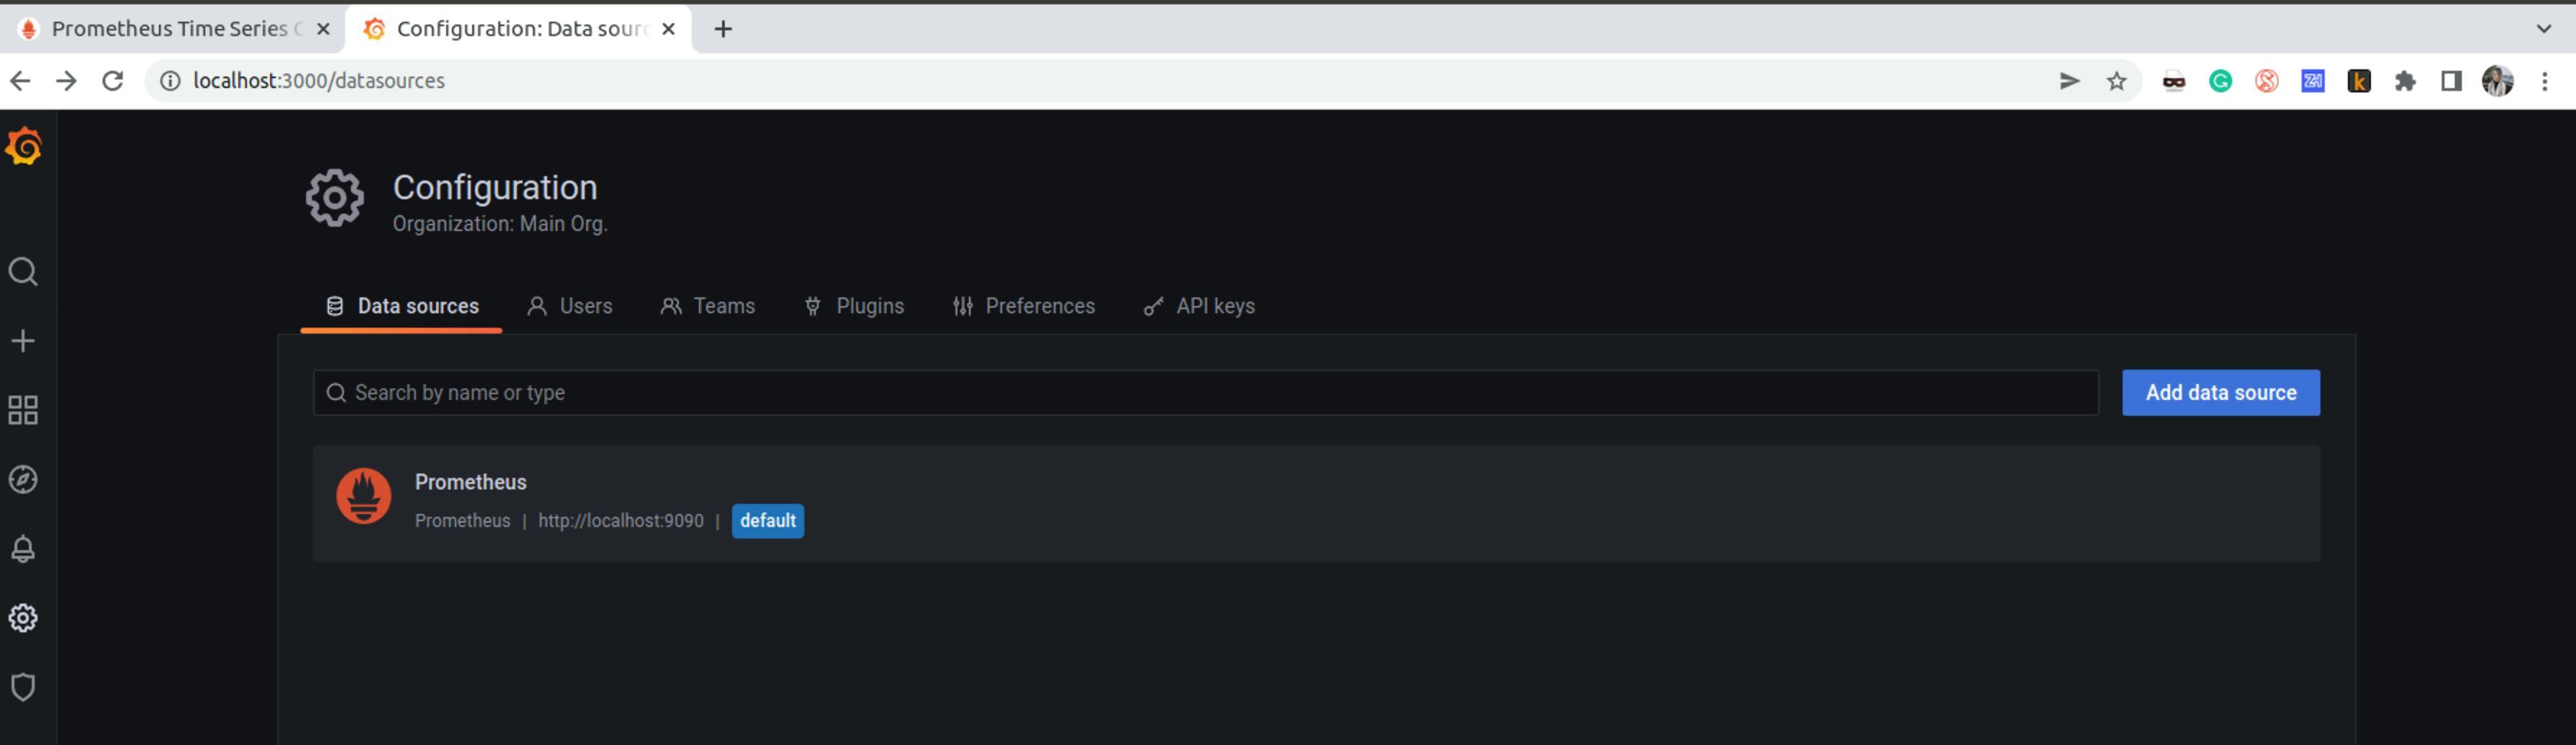
Configure Grafana to use Prometheus as a data source
Go to the Data sources in Configuration and add Prometheus as a data source. Set URL for this data source to http://localhost:9090.
Watch this guide about Getting started with Grafana for more details.
Example of usage
Imagine we have a simple C++ application. The app creates 4 threads and printout messages in while loops with some random sleeps. We wanna visualize how much CPU each thread is taking, and how much memory the whole process need for execution over an hour.
sample_app.cpp
#include <string>
#include <iostream>
#include <vector>
#include <thread>

void print(int n, const std::string &str){
  unsigned run_times = 1000000;
    while(run_times) {
    std::string msg = std::to_string(n) + " : " + str;
    std::cout << msg  << std::endl;
    std::this_thread::sleep_for(std::chrono::microseconds(run_times/100));
    --run_times;
  }
}

int main(){
    std::vector<std::string> s = {
        "message 0",
        "message 1",
        "message 2",
        "message 3"
    };
    std::vector<std::thread> threads;
      for (int i = 0; i < s.size(); i++){
        threads.push_back(std::thread(print, i, s[i]));
        }

   for(auto &th : threads){
          th.join();
     }

  return 0;
}
Compiled and executed it. We should be able to see namedprocess_namegroup_thread_cpu_seconds_total in Prometheus prompt:
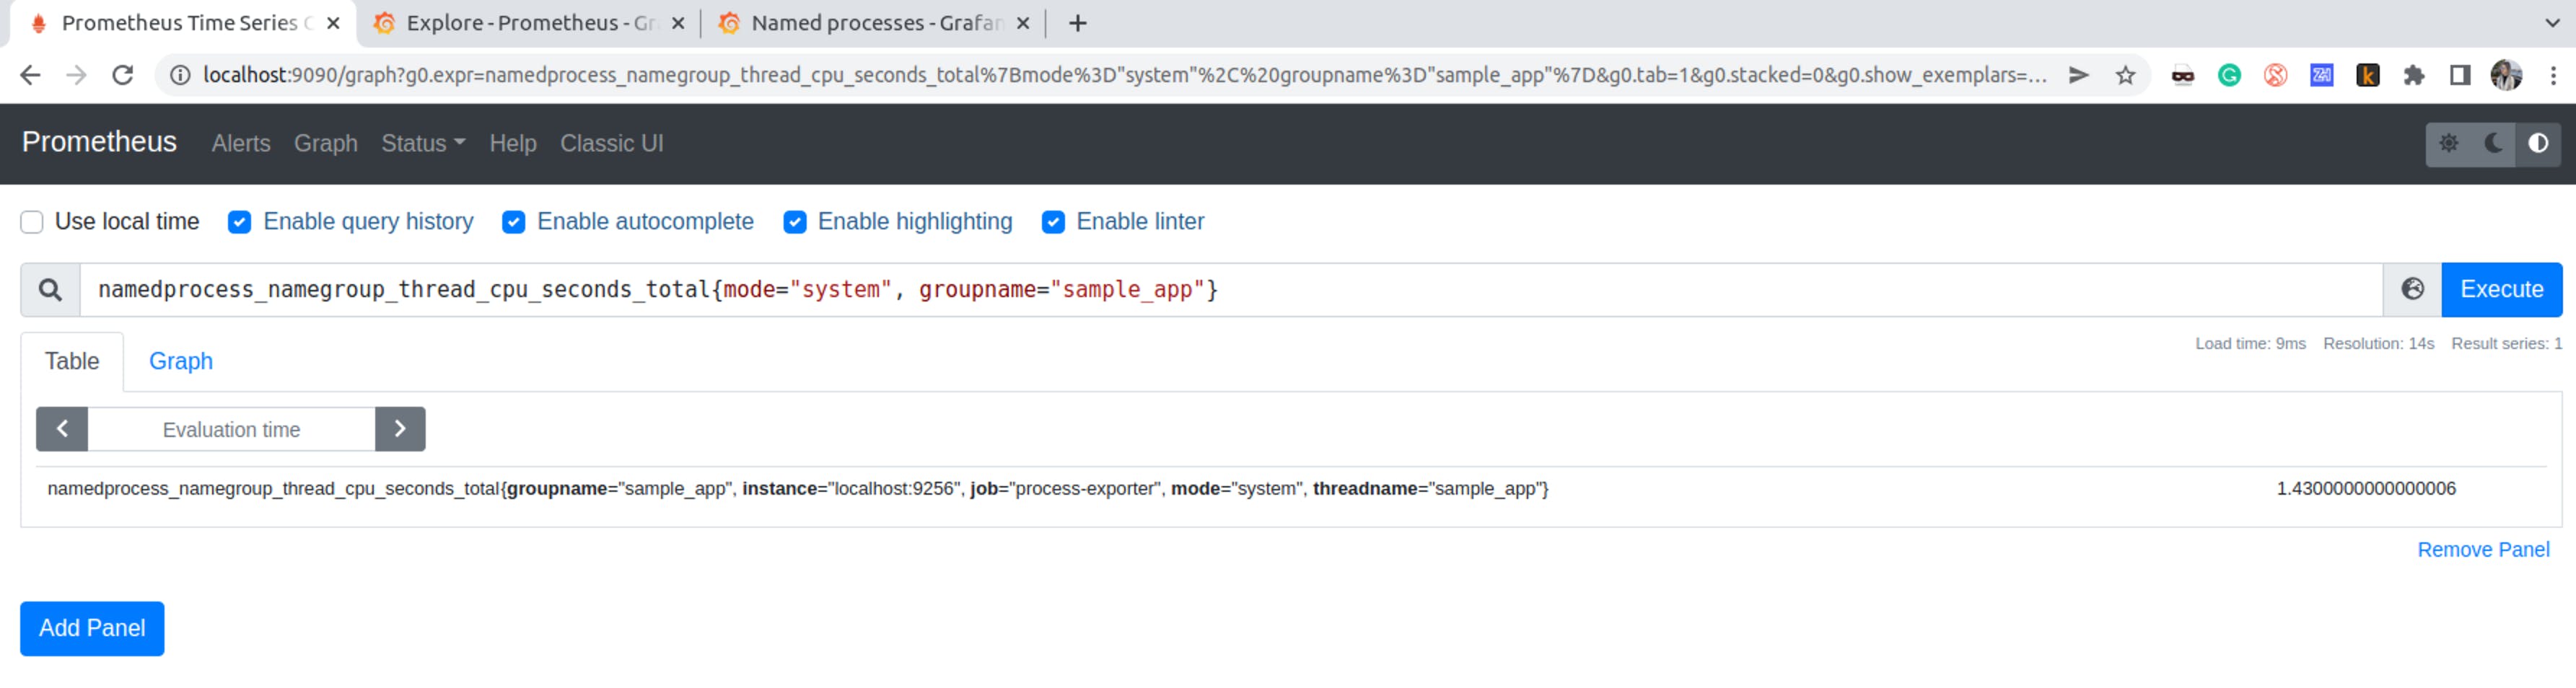
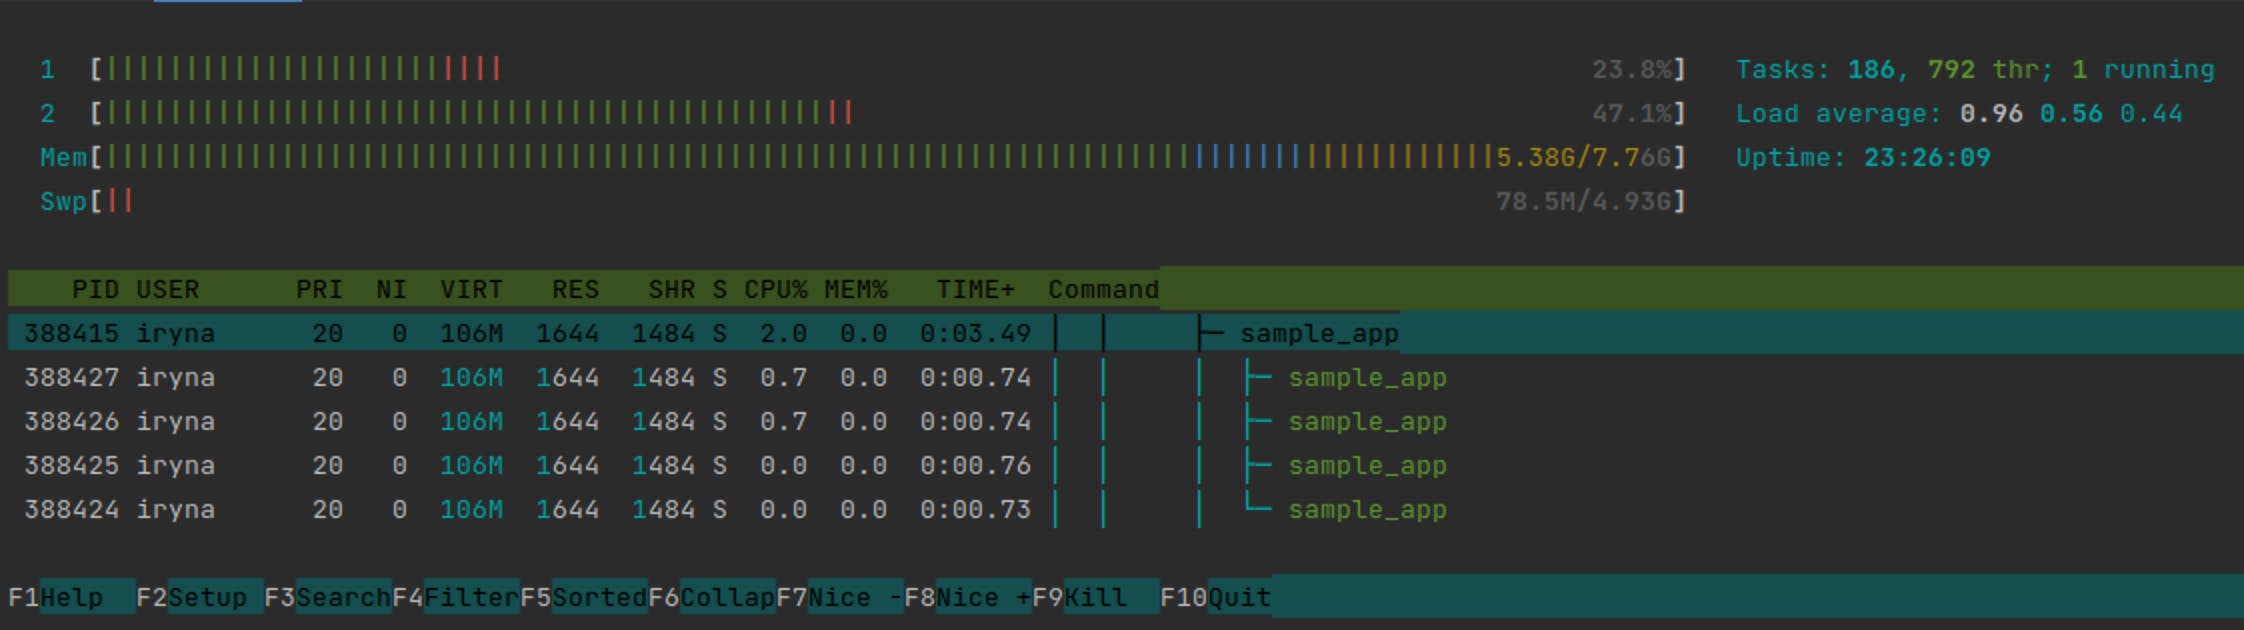
Wondering why there is only one thread name, while we were expected to see 4 threads, besides the main process thread? That’s because we need to give a proper name to the threads. Let’s check it out with htop:
htop -p $(pgrep -d',' -f ./sample_app)
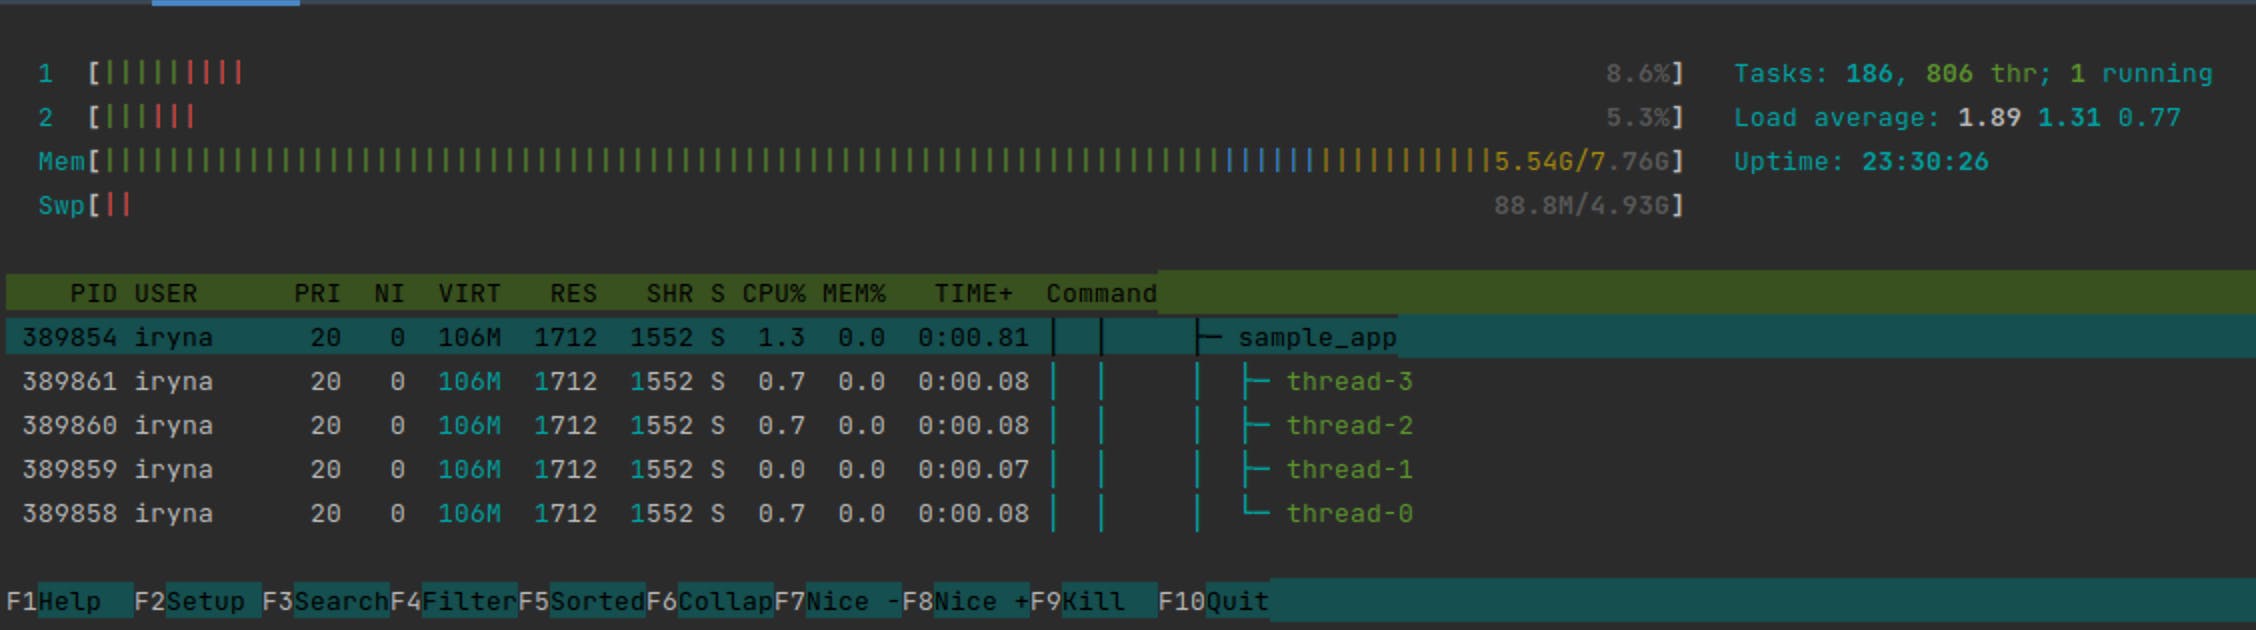
In order to be able to distinguish threads, we need to give them names. I used prctl system function for this.
#include <sys/prctl.h>

void print(int n, const std::string &str){
    unsigned run_times = 1000000;
    std::string thread_name = "thread-" + std::to_string(n);
  prctl(PR_SET_NAME, thread_name.c_str(), 0, 0, 0);

    while(run_times) {...}

}
...
Now it’s better:
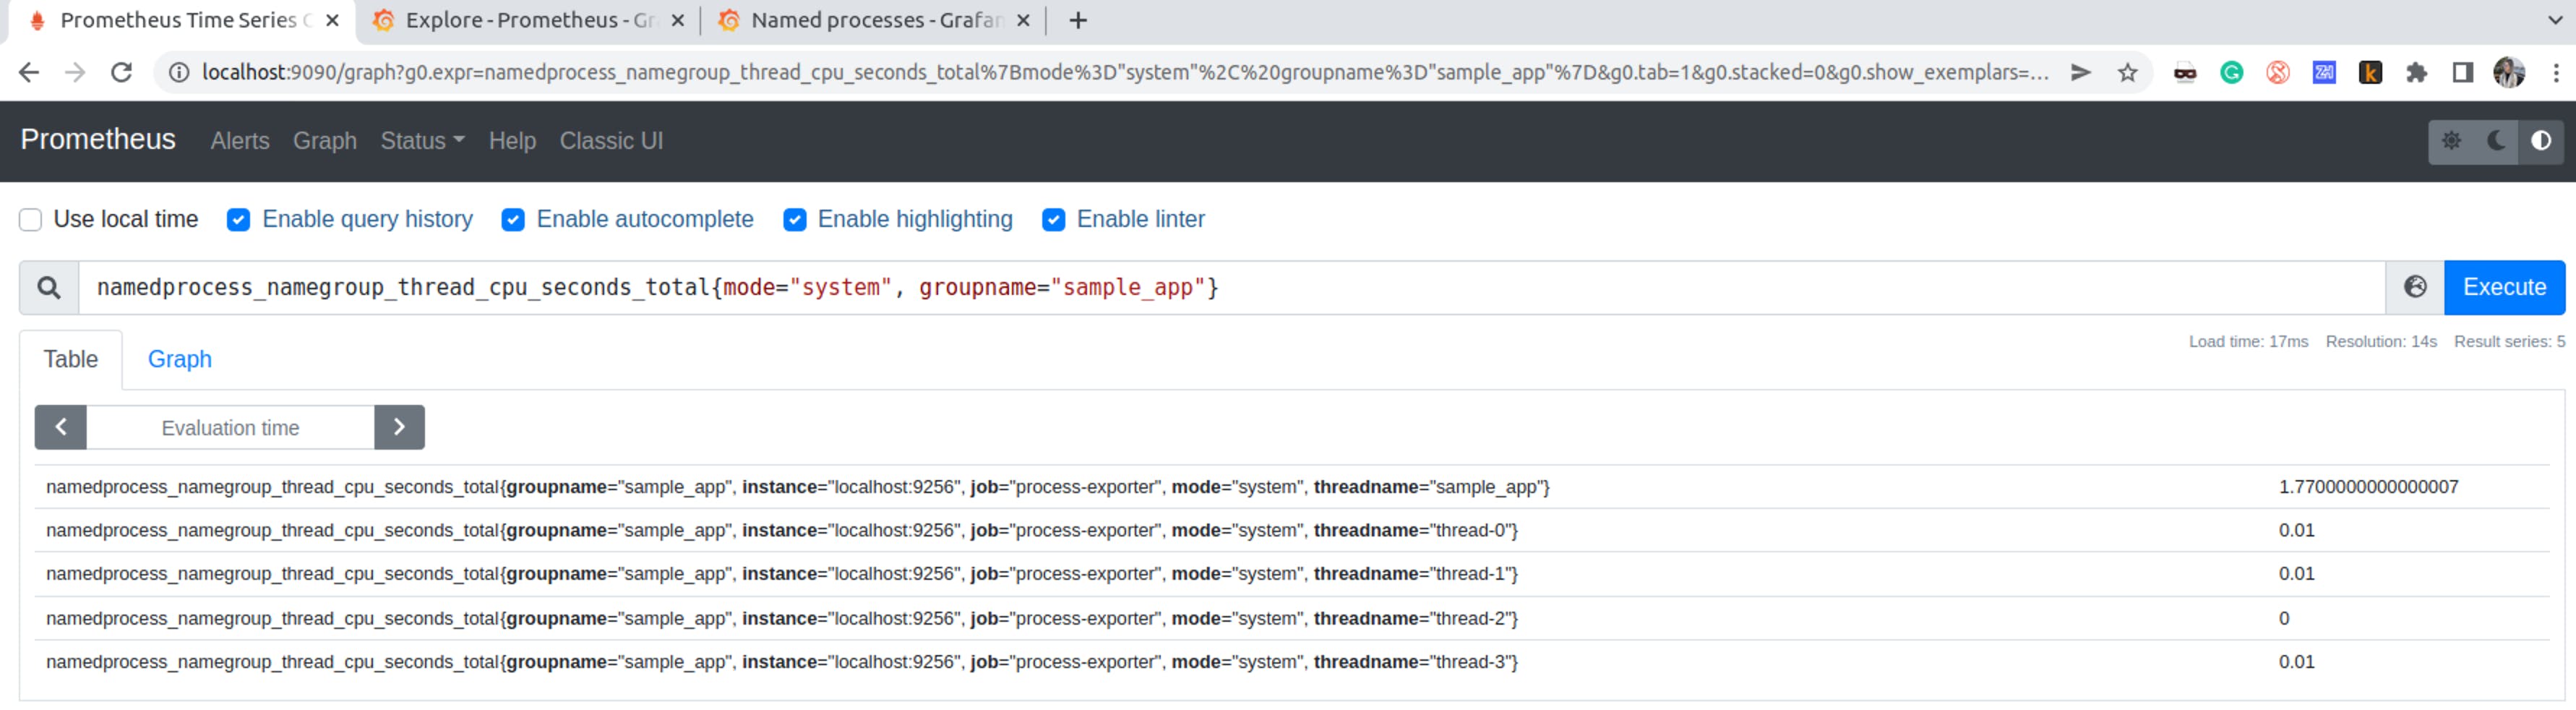
The next step is to visualize these metrics in Grafana and PromQL (read about PromQL here and here).
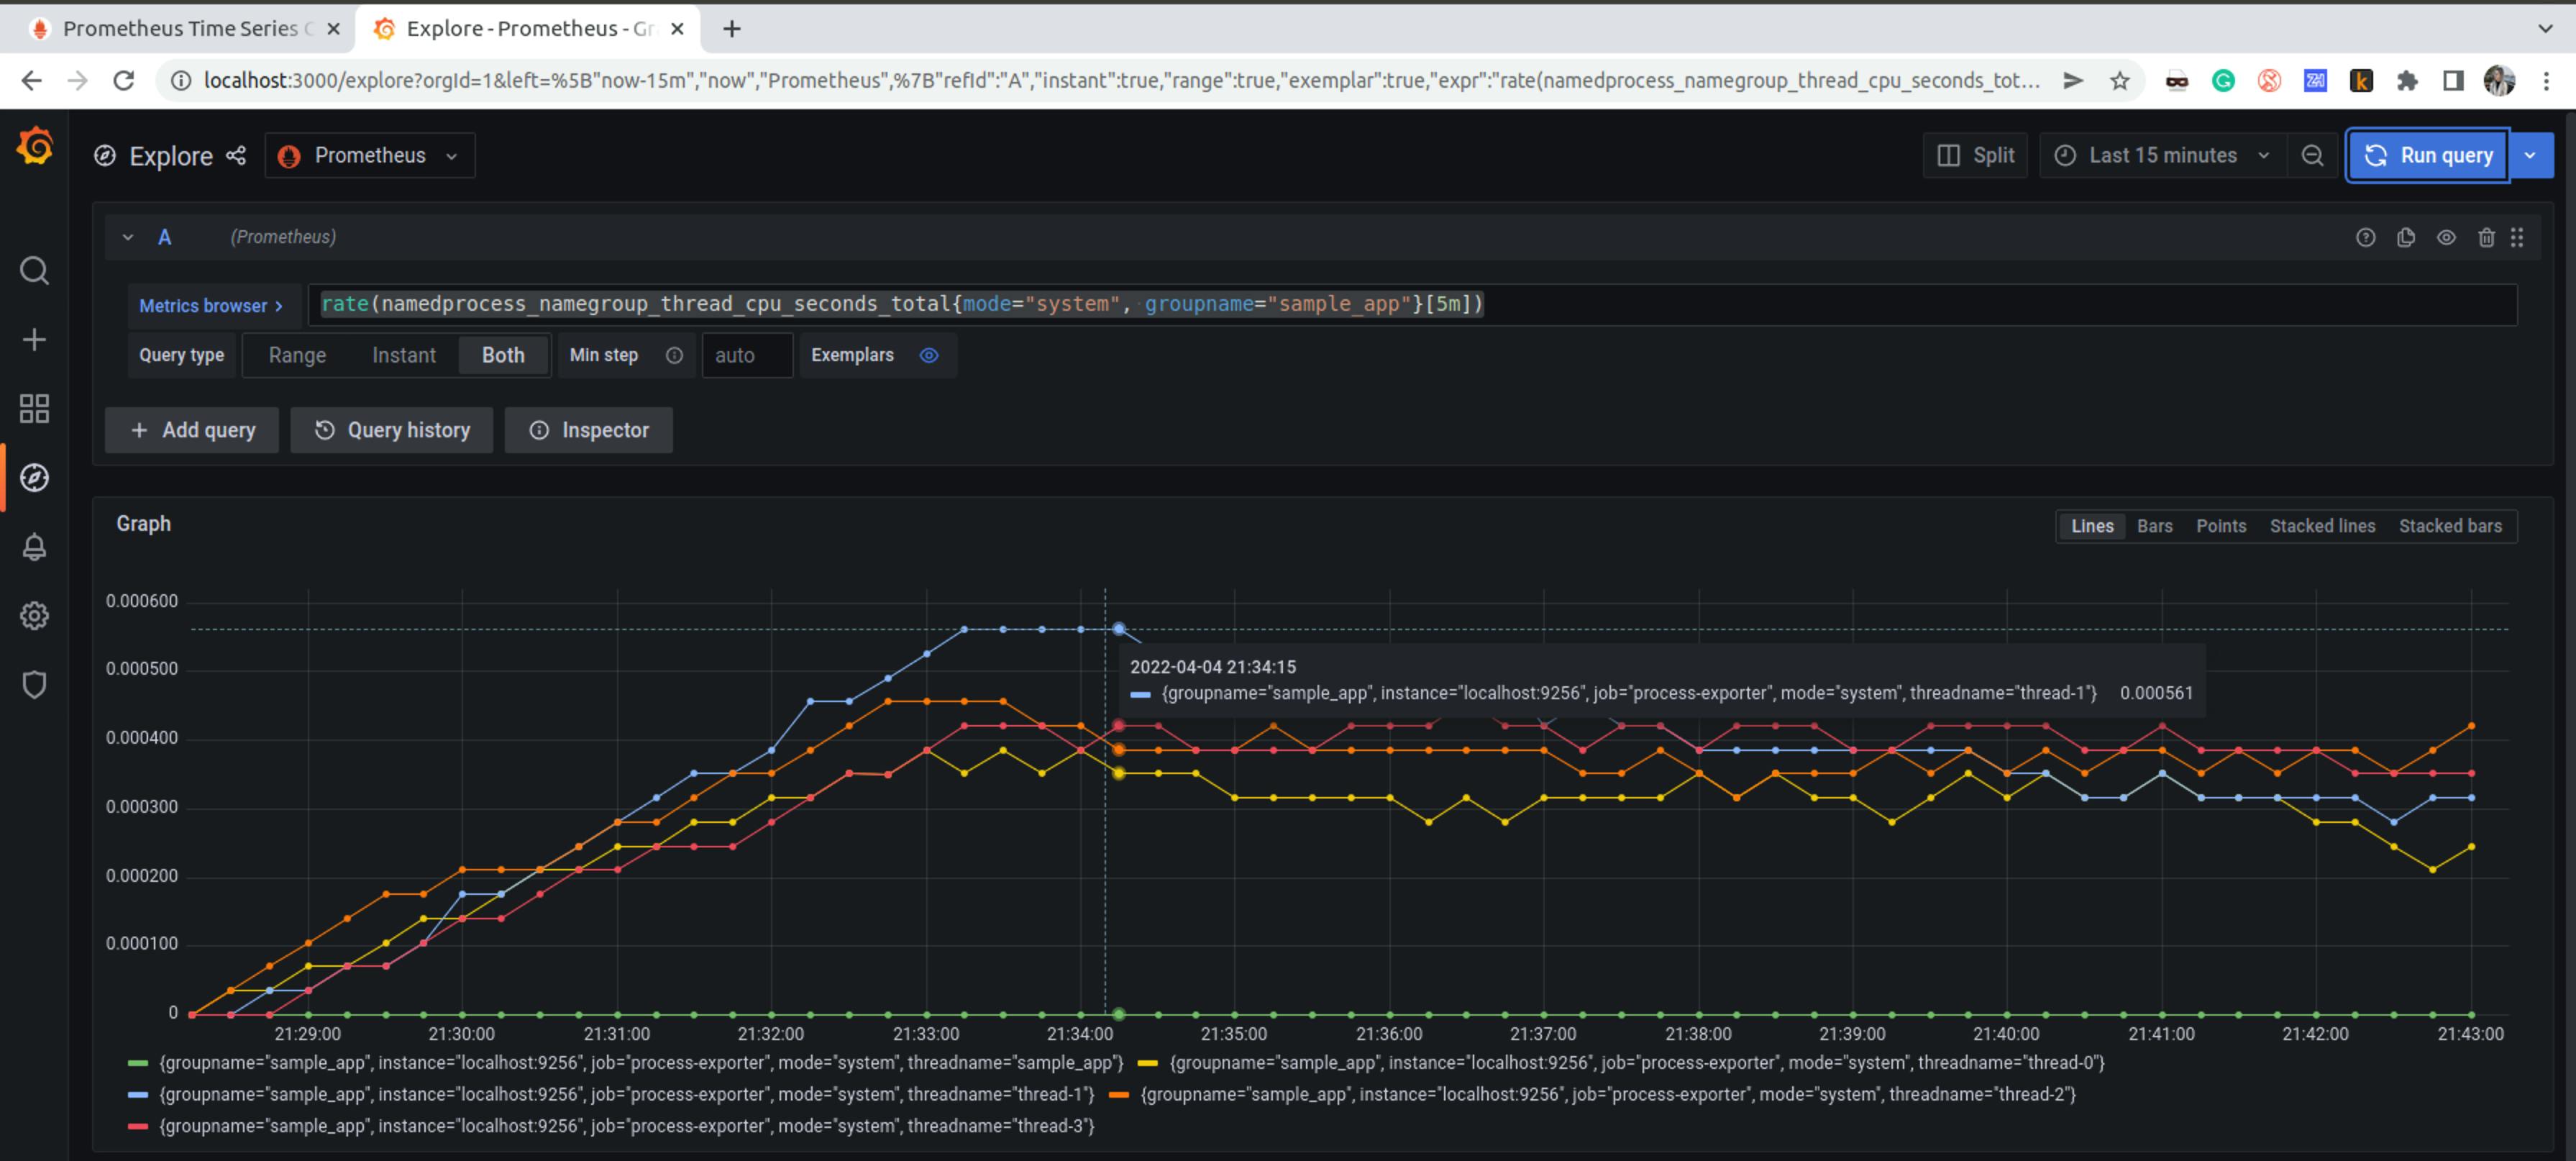
Explore
Go to Explore section in Grafana and run the query rate(namedprocess_namegroup_thread_cpu_seconds_total{mode="system", groupname="sample_app"}[5m]). Observing separate threads may be useful if you wanna see optimisation gups.
Visualize other useful data about your process
Use predefined Grafana dashboard to visualize CPU, memory usage, read/write bytes of your process: https://grafana.net/dashboards/249. Just import it to Grafana.
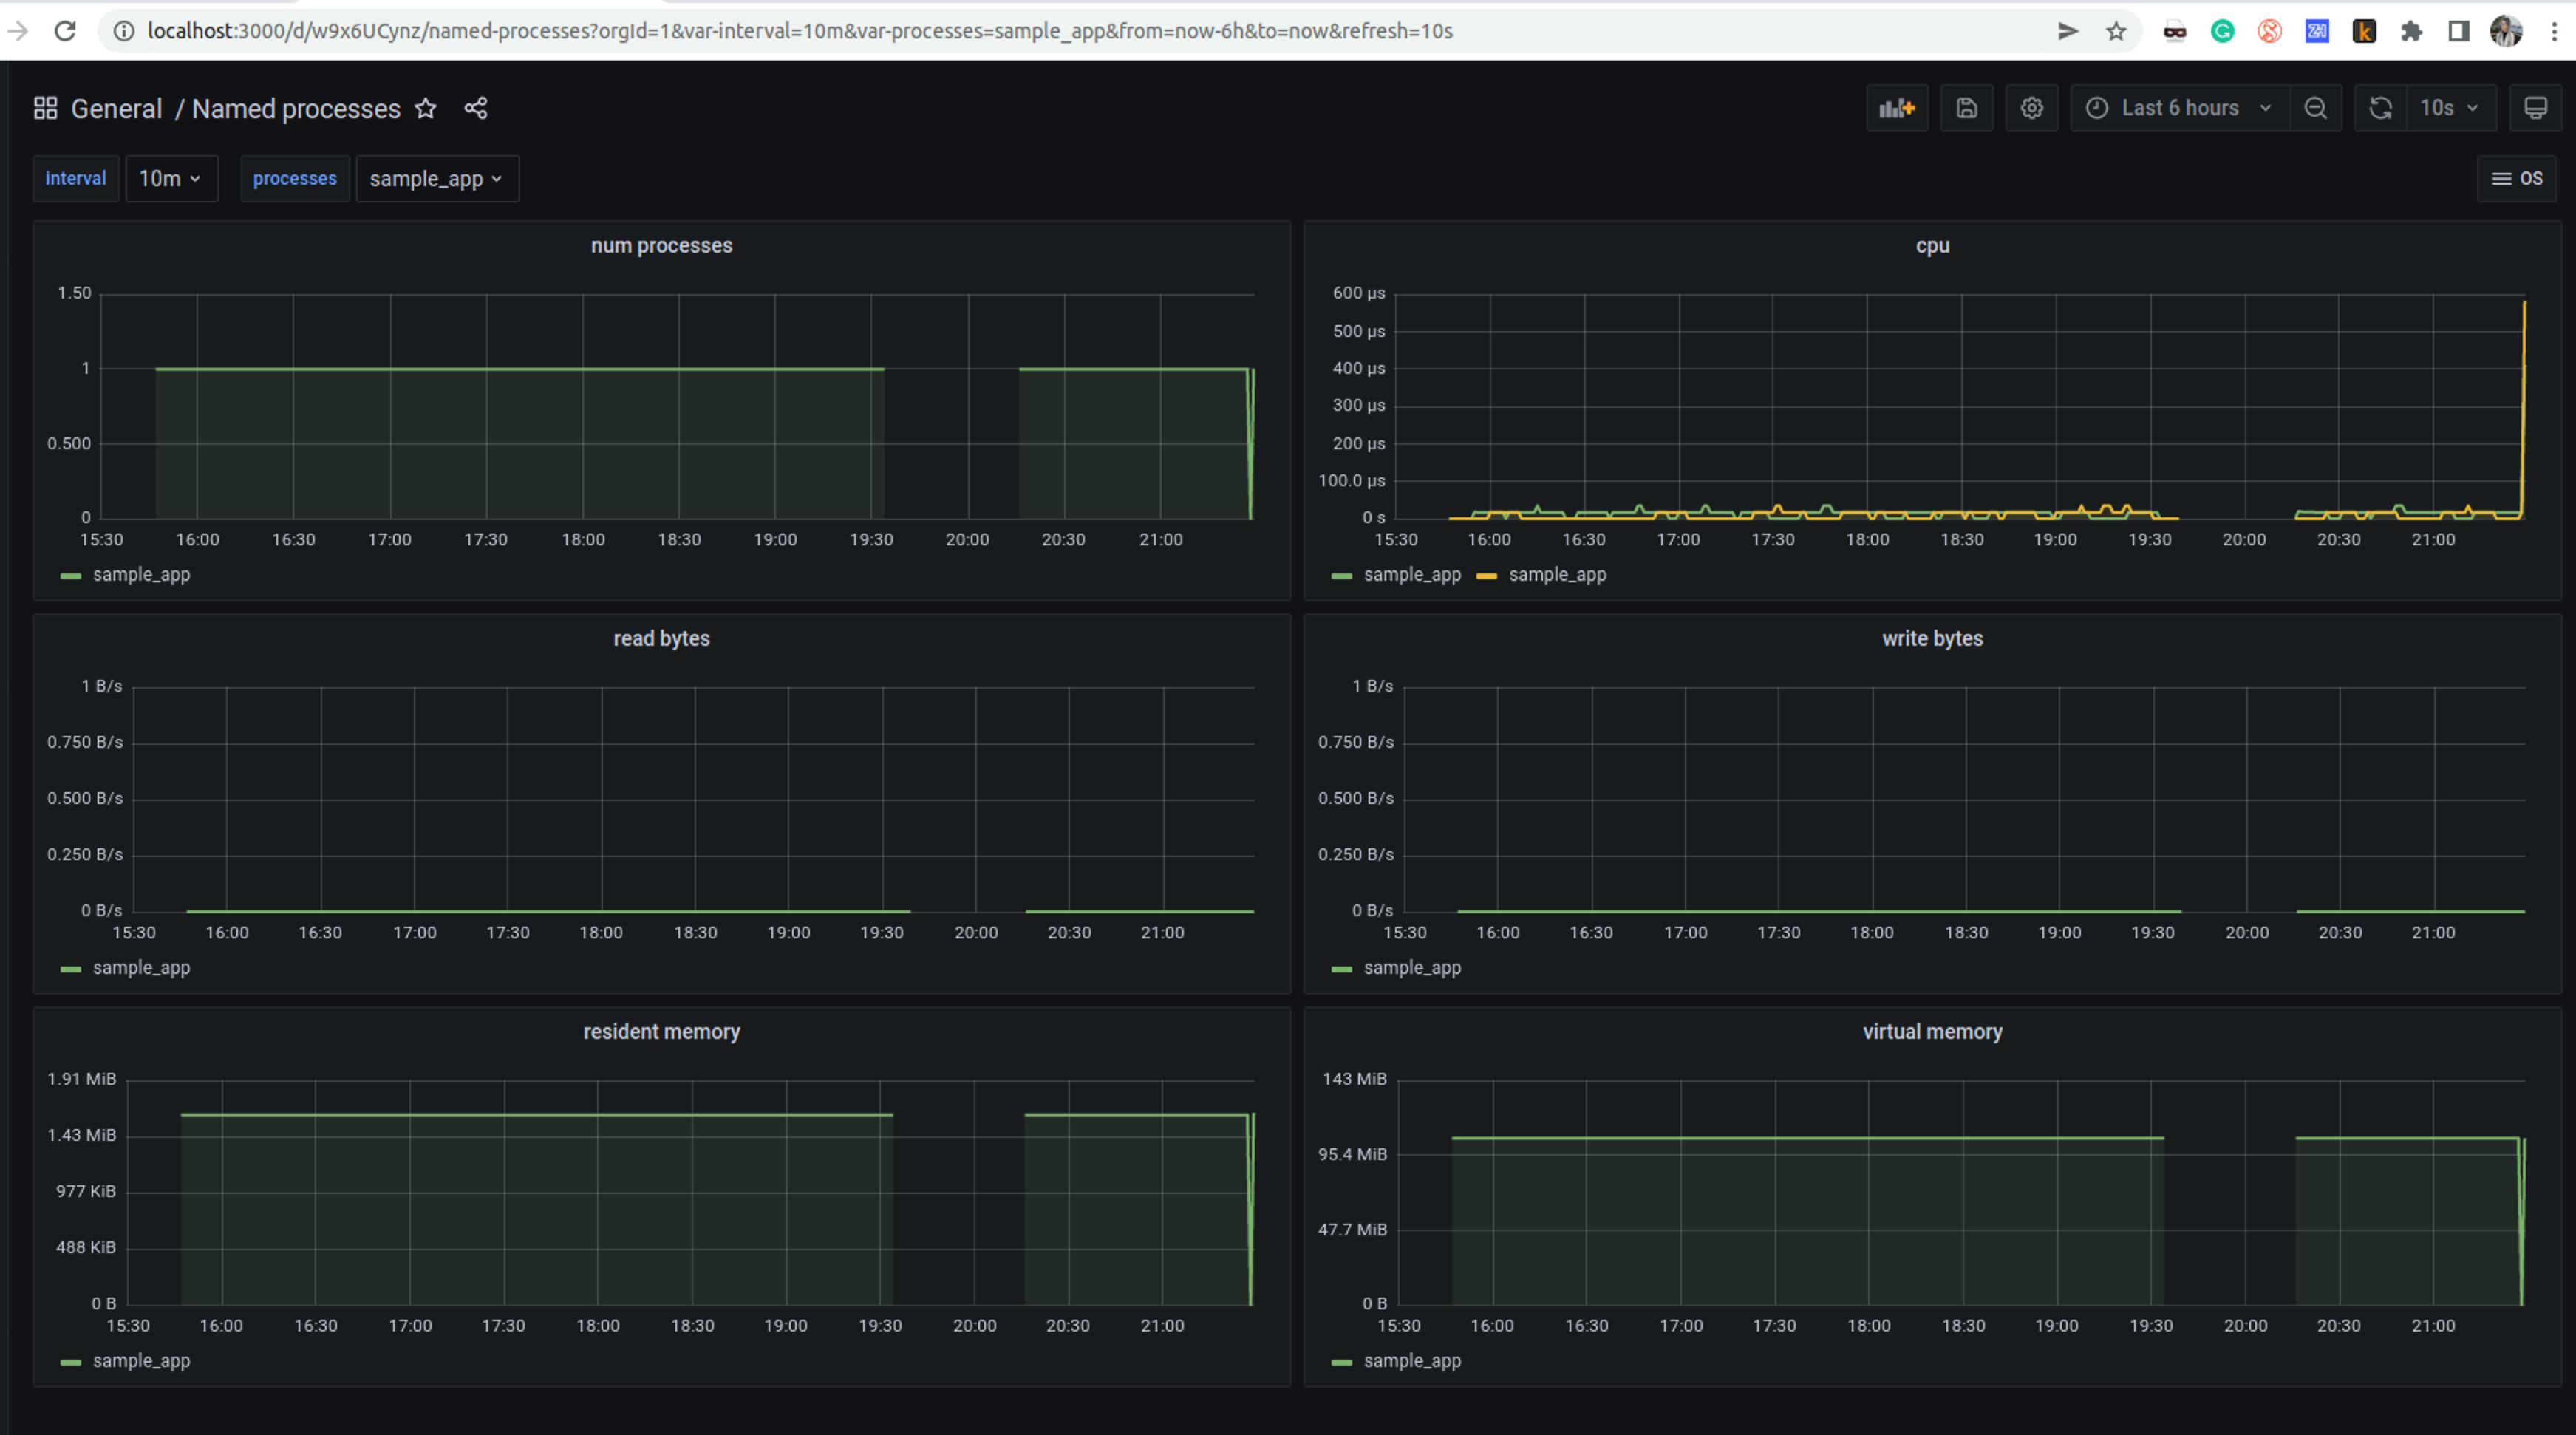
Don’t know what Resident and Virtual memory mean on this dashboard? In my next article, I will talk about Linux memory, follow me so don’t miss this and other blog posts.
#SupportUkraine #StandWithUkraine 🇺🇦
Please support Ukraine if this article was interesting for you: lnkd.in/gi_F9Zsh.